Chevron CEO Mike Wirth has warned oil prices will jump over summer as supplies dwindle. Wirth also said that “over the next few weeks, we are likely to see those pressures flow through more directly to physical prices, and there is more upwards pressure that I would expect as we get into June and certainly into July”. Meanwhile, ExxonMobil Senior Vice-President Neil Chapman commented that “we are approaching unheard of inventory levels. I mean, really, really low levels. You can debate whether that is going to hit those really low levels in two weeks or three weeks. Once you get to that point, then you will see [the] price shoot up… to $150/bl, $160/bl.”
The comments by Wirth and Chapman are understandable. The data make clear the Strait of Hormuz closure has cut global oil supplies by perhaps 11m b/d.
The data also makes clear, however, that this crisis is much different from past disruptions in several respects. First, the world’s leading oil importer, China, sharply cut its imports. Second, the US boosted oil exports, helping to fill the supply/demand gap created by the war in Iran. Import reductions and inventory draws by other nations have further moderated the war’s impact. Lastly, many of the more vulnerable nations have embarked on intensive efforts to reduce or end oil and LNG imports. Some of those transitions will be temporary. But others could produce significant permanent reductions in oil and gas consumption.
“We are approaching unheard of inventory levels” Chapman, ExxonMobil
The declines in oil and gas imports and consumption underscore a point often missed by long-term forecasts of global energy demand: transitions are driven by demand. Vaclav Smil, the University of Manitoba professor who has written extensively on how societies move from one energy source to another at glacial speed, ignores evidence from the last quarter-century that shows how quickly the world can abandon an out-of-date product.
We can illustrate that speed through the major shift in telecommunications since Apple introduced the iPhone in 2007. Had the transition to mobile phones from landlines been as slow as Smil would have expected, Apple’s market capitalisation today might be $150b rather than $4.5t, while AT&T’s might be $2t instead of $170b. Consumers—not manufacturers, miners or utilities—drove the switch to mobile phones as the devices became less expensive and more convenient. It will be the same for fossil fuels as alternative energy sources become cheaper and more reliable. That shift is already underway and gaining momentum rapidly.
The point is, then, that the pace of the transition away from fossil fuels has limited increases in oil and petroleum product prices and may continue to do so this summer and beyond.
Surprising calm
The increase in crude oil prices from 27 February to the end of May has been unexpectedly modest, given the uncertain magnitude of the global oil supply disruption. Dated Brent prices have risen by only 51% despite a supply loss of between 11m b/d and 16m b/d. The disruption is uncertain because published estimates of the loss vary widely.
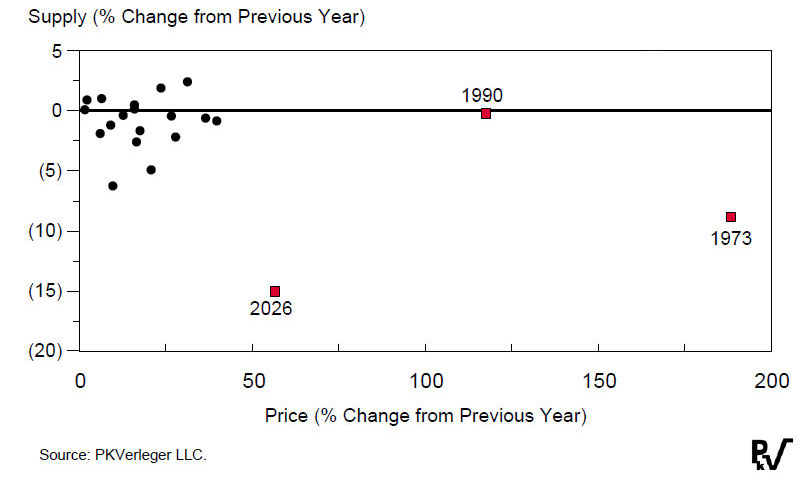
The price hikes should have been one or two times as large based on data from the past 22 disruptions, even if it is assumed the supply loss has been ‘limited’ to around 9m b/d. As Fig.1 makes clear, the current increase is an outlier from those in past market upsets.
The calculations are summarised in Fig.2. China reduced its global demand by 5.4m b/d from February to May while reducing product exports by nearly 500,000b/d. Higher US exports offset another 2.9m b/d of the global supply loss. The total decline amounted to 8.3m b/d, with cuts in demand in other countries contributing to the reduced consumption.
FIG 2: SUPPLY FACTORS REDUCING THE PRICE IMPACT OF GLOBAL LNG SUPPLY LOSS
Factor | Supply loss (mt) |
|---|---|
Reduction in Chinese demand | 5.4 |
Increase in US exports | 2.9 |
Decline in consumption | 2.0 |
Decrease in Japanese imports | 1.4 |
Total | 11.7 |
JPMorgan oil market analyst Natasha Kaneva commented on the supply loss, asking, “Can the world live with 9% less oil?” In an article, she noted: “Unlike 2022, when the energy shock registered as an acute macroeconomic crisis, this oil shock has, so far, felt oddly more manageable, even as it marks the largest disruption to oil markets on record. Even with oil prices nearing $120/bl in April and May, electricity prices across most European countries continued to slip into negative territory, pushed down by massive surges in solar and wind generation.”
Kaneva also observed that China’s oil use had declined. Air travel in the country was down by more than 6%, a loss that could be permanent given China’s burgeoning high-speed rail service, which is “often faster, cheaper and increasingly the default choice for domestic travel”. Gasoline use fell without a corresponding decline in road travel, suggesting growing adoption of electric vehicles.
Comparing today to 1973, Kaneva wrote the previous crisis pushed the world to use energy more efficiently. In contrast, in 2026, a “meaningful share of the reduction” could be coming from substitution.
The declines in oil and gas imports and consumption underscore a point often missed by long-term forecasts of global energy demand: transitions are driven by demand
It is doubtful the world saw demand drop by 9%, or around 9m b/d, from pre-war levels, but it is clear that some change has occurred. In Fig.2, a reduction of 2m b/d has been added to reflect lower crude oil consumption and petrochemical use. Much of that decline has occurred in developing nations that cannot afford higher oil prices. Bangladesh, for example, has rationed fuel and limited vehicle sales. Indonesia has taken similar measures. Other lower-income countries have likely done the same. Petroleum use has also likely declined in Middle Eastern countries, such as the UAE, which have been directly affected by the war.
As Fig.2 indicates, Japan has also contributed significantly to reducing pressure on the global market. Japan’s crude oil imports in April fell nearly 66% from a year earlier, hitting the lowest in more than 60 years as the US-Iran conflict disrupted supplies from the Middle East. Imports were at their lowest level since November 1962.
The net effect of import cuts and export increases and the drop in consumption brings the offsets for the Hormuz closure to nearly 12m b/d. This number could be higher if the imports of EU nations have also declined.
The path ahead: riskier?
Jeff Currie, a widely quoted commentator on commodities, noted that “oil storage tanks in the US are on track to run empty around 4 July”. Currie, senior advisor at investment management firm Carlyle Group, signalled a deepening energy crisis that could disrupt markets and fuel supplies. Currie has been painting a grim picture of global oil availability. At the end of May, Helima Croft, another widely quoted analyst, said: “Even if a deal is done tomorrow, it will probably take six weeks to debottleneck the strait, only adding to pressure in inventories during peak summer demand season. Europe could easily see rationing.”
Croft added that inventories globally are “fast approaching tank bottoms”. Despite this, prices have not increased because, in her view, “market participants have been anaesthetised by the constant ‘over soon’ messaging.”
Croft implies oil traders are confident the US and President Trump will reach an agreement with Iran to reopen the Strait of Hormuz within days or weeks. This view is at odds with most commentaries. For example, information provider Argus Media offered this observation: “Talks between the US and Iran on a deal to end the war and fully reopen the strait are continuing, but with little real sign of the compromise needed to make progress, despite bullish rhetoric on both sides. US President Donald Trump said on 23 May that an agreement with Iran to reopen the strait was “largely negotiated”, but that he had instructed US negotiators “not to rush into a deal” and to “take their time and get it right”.
Trump has continued to vacillate, seemingly having difficulty reconciling Israeli Prime Minister Benjamin Netanyahu’s demands to finish the Iran war with the pressure from his advisers to avoid further destabilising oil markets before the November elections. This suggests the ceasefire will continue and the flow of ships out of the Mideast Gulf will remain low.
If it is assumed that traders base their plans on such an outcome, the question then becomes: “Can the calm continue?” It can be concluded that it can, based on the argument that the global transition away from fossil fuels will be quick.
A quick transition?
Smil may be the world’s most widely quoted authority on the history of energy transitions. In his works, he asserts such transitions are slow. Oil industry executives and officials in the Trump administration concur. While Smil’s assertion may have been true for past energy transitions, it no longer holds today. This can be called the ‘Smil fallacy’.
In 2014, Smil wrote in Scientific American that it would be “unthinkable” for countries that spent at least $20t on fossil fuel systems to abandon their infrastructures. As an example, he singled out China, which at the time had spent over $500b on coal-fired power plants. After listing other examples, he declared that “no country will walk away from such investments”.
Twelve years later, Smil’s comment about countries “not walking away” has proven wrong. China, for example, is all in on transitioning to solar and wind power and electric vehicles. Other countries have been similarly aggressive. Pakistan has rushed to replace gas-fired electric generation with solar power since its LNG imports quadrupled in price in 2022.
The almost-complete collapse of landline phone services offers further evidence of the Smil fallacy. In recent years, telephone companies have initiated massive write-offs of investment in landlines. In 2024, Verizon wrote off $5.8b due to declining demand for wireline services. AT&T likewise wants to stop spending $6b on wireline communications. Other firms are rushing to do the same.
Smil’s assertion may have been true for past energy transitions, it no longer holds today
Executives of the old integrated phone companies would be amazed by these developments. These executives did not anticipate the impact of mobile phones. They certainly did not try to force consumers to abandon landlines. Consumers did so on their own when a more useful and less-expensive alternative became available. The same type of shift happened with first-class mail and film photography.
The oil and gas sector faces a similar threat in 2026. On Kaneva’s query about whether the world could “live with 9% less oil”, she perhaps answered her question herself by noting that oil use had dropped in China by that amount “with little visible disruption”, adding that, “Globally, we track demand losses of 2.8m b/d in March, 4.3m b/d in April, and 5.6m b/d in May, while acknowledging extremely limited visibility in parts of Africa and Southeast Asia. Roughly 40–60% of the decline reflects weaker petrochemical feedstock demand, with the remainder coming from transport fuels.” These cuts occurred while the impact on economic activity has been “constrained.”
Today, data on recent economic activity in developed nations that might provide more information on the use of petroleum and other energy goods are not yet available. Information on vehicle miles travelled in the US and European countries does not yet include data for March.
In the coming weeks, the situation will become clearer via data on vehicle miles travelled, acres planted by farmers and airplane flight miles. At this juncture, information derived from prices, particularly petroleum product prices, is all that is available.
Given the absence of any real price pressures, the concerns of Chevron’s Wirth, other oil officials, and commentators such as Currie are—at the very least—premature. Instead, it appears global consumers are transitioning from oil and gas quickly. Whether this shift is permanent or temporary remains to be seen.
Markets: Why speculate on oil?
Wirth and Chapman have good reasons to be concerned. Key product inventories at US facilities are falling. Further, the rise in the price of renewable identification numbers (RINs) increases the incentive for refiners to export products rather than sell to US customers. The continued tightening in global product markets, combined with the international hucksterism of Energy Secretary Chris Wright, could send US product prices up another 25–50%. The resulting retail price boost could create political pressure that forces Republicans to take actions adverse to the oil industry, just as President Richard Nixon and Treasury Secretary John Connally did in 1973.
Wirth, Chapman, and other industry officials—as well as Currie—likely hope investors and money managers will respond to their predictions of dwindling supplies by buying options and futures on crude oil and products, lifting prices.
Such hopes are forlorn. At the end of May, money managers reduced their long positions by 13%. Since early April, they have lowered these positions by 30%. The move away from oil can be attributed to Trump’s waffling over the Iranian ceasefire. Speculators today can choose between taking a position in Elon Musk’s forthcoming SpaceX IPO and buying oil futures. Given the uncertainty over Iran, the decision seems obvious. This leaves oil markets short of the buyers needed to raise prices.
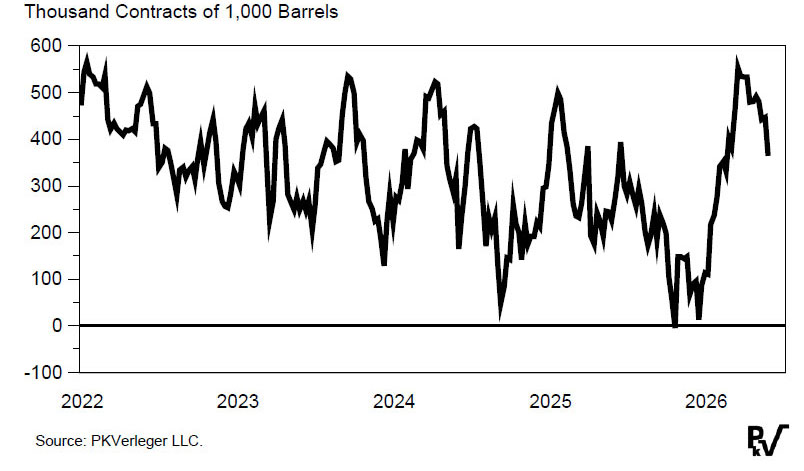
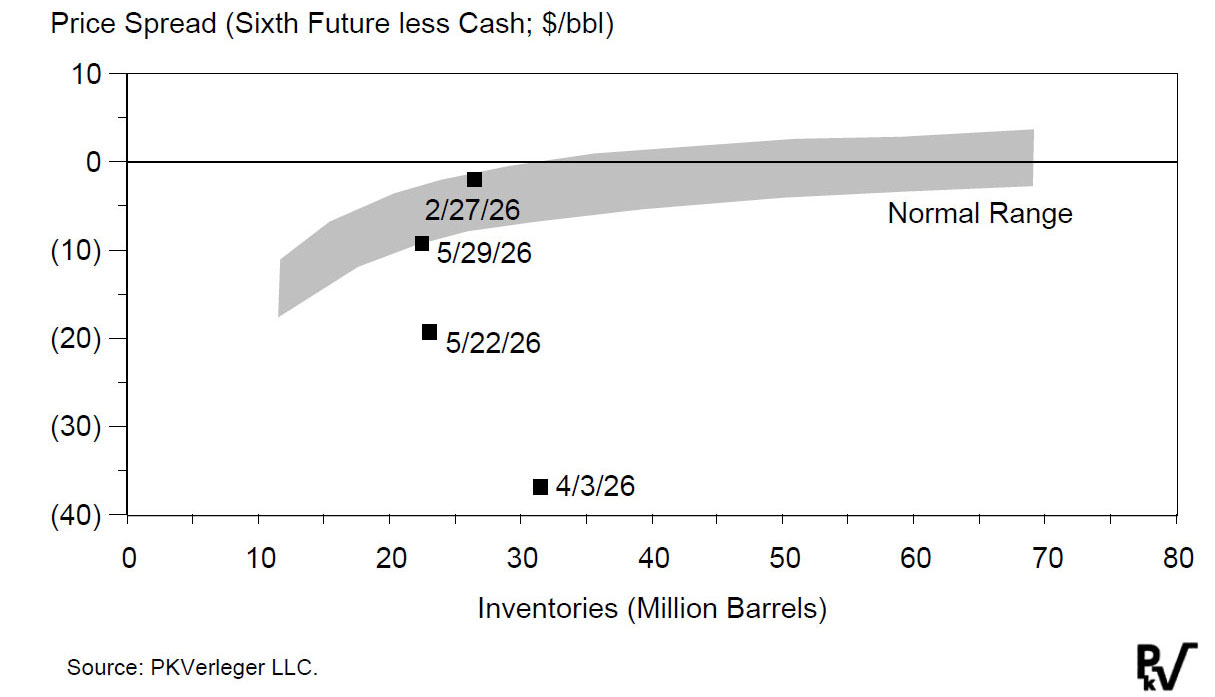
Fig.3 shows the drop in the net long position of money managers. While their position is still strong, it has shrunk.
Crude oil buyers are also less concerned about a coming price increase than they were. Backwardation has declined, as indicated by excess returns to storage. The drop is also visible in the supply-of-storage curve for crude, shown in Fig.4.
The uncertainty regarding the ceasefire has apparently reduced refiners' willingness to add to crude inventories, and US gasoline inventories are falling rapidly.
Spot gasoline prices in New York Harbor have yet to reflect the tightness, but Wirth and Chapman likely worry spot US gasoline prices will spike by $0.40/gal in the coming weeks if stocks continue to fall.
There is, however, an alternative explanation for the quiet markets: the uncertainty regarding Trump’s next actions on Iran may be responsible for the absence of extreme backwardation and aggressive crude oil and product buying. It is possible that traders, refiners and marketers are limiting their purchases because they lack confidence in the US’ ability to reach a permanent resolution to the conflict.
Dr. Philip Verleger received his PhD in Economics from MIT in 1971. He has studied energy and financial markets since. In 2023, Dr. Verleger was named 'Energy Writer of the Year' along with his editor Kim Pederson. Previous winners of the award include Daniel Yergin (2000) and Vaclav Smil (2019).